Galaxy Announces Third Quarter 2025 Financial Results
NEW YORK, Oct. 21, 2025 /CNW/ - Galaxy Digital Inc. (Nasdaq: GLXY) (TSX: GLXY) (the "Company" or "GDI") today released financial results for the three and nine months ended September 30, 2025. In this press release, a reference to "Galaxy", "we", "our" and similar words refers to GDI, its subsidiaries and affiliates, and, prior to the Reorganization Transactions, refers to Galaxy Digital Holdings LP (the "Partnership" or "GDH LP"), its subsidiaries and affiliates, or any one of them, as the context requires.1
-- Financial Highlights
- Net income of $505 million for Q3 2025, diluted EPS of $1.01, and adjusted EPS of $1.12.2
- Adjusted EBITDA of $629 million for Q3 2025, driven by record results in the Digital Assets operating business and gains on digital asset and investment positions.2
- Total equity of $3.2 billion and holdings of $1.9 billion in cash and stablecoins as of September 30, 2025.3
-- Corporate Updates
- Record quarterly digital asset trading volumes, up 140% versus Q2 2025, reflecting increased spot and derivatives activity and the sale of more than 80,000 bitcoin on behalf of a client.
- Total assets on platform reached an all-time high of approximately $17 billion at quarter end.4
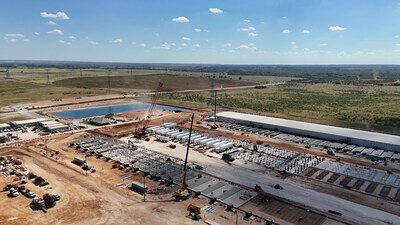
- Executed a lease agreement with CoreWeave for Phase II of the Helios data center development. CoreWeave also exercised its final option to access an additional 133 MW of critical IT load for its artificial intelligence ("AI") and high-performance computing ("HPC") operations, bringing its total commitment to the full 800 MW of approved power capacity at Helios.
- Galaxy secured a $1.4 billion project financing facility, fully funding the $1.7 billion Phase I build at Helios.
- On October 6, 2025, Galaxy launched GalaxyOne, a financial technology platform that provides U.S.-based individual investors access to high-yield cash, cryptocurrencies and equities trading all through a single, unified platform.
- On October 10, 2025, Galaxy announced a $460 million equity investment by one of the world's largest asset managers. Net proceeds to Galaxy of $325 million will drive the build out of the Helios data center campus and support general corporate purposes.
|
|
SELECT FINANCIAL METRICS |
Q3 2025 |
Q2 2025 |
Q/Q % Change |
|
||
|
|
Total Assets |
$11,523M |
|
$9,086M |
27 % |
|
|
|
|
Total Equity |
$3,172M |
|
$2,624M |
21 % |
|
|
|
|
Cash & Stablecoins3 |
$1,910M |
$1,181M |
62 % |
|
||
|
|
Net Digital Assets and Investments5 |
$2,141M |
$1,871M |
14 % |
|
||
|
|
Net Income / (Loss) |
$505M |
$30.7M |
1,546 % |
|
||
|
|
Adjusted EBITDA2 |
$629M |
$211M |
198 % |
|
||
|
|
|
|||||
|
|
Note: Throughout this document, totals may not sum due to rounding. Percentage change calculations are based on unrounded results. N.M. is the abbreviation for "Not Meaningful". (1) On May 13, 2025, the Company, GDH Ltd. and GDH LP consummated a series of transactions resulting in the reorganization of the Company's corporate structure (the "Reorganization Transactions"). (2) Adjusted EPS and Adjusted EBITDA are non-GAAP financial measures. Refer to pages 11 and 12 for more information and a non-GAAP to GAAP reconciliation to the most directly comparable GAAP measure. (3) Includes $1,137M in Cash and Cash Equivalents, and $773M in Stablecoins as of Q3 2025 and $691M in Cash and Cash Equivalents, and $489M in Stablecoins as of Q2 2025. (4) Consists of $8.8B Assets Under Management, $6.6B Assets Under Stake and $1.7B of assets managed by a commodity pool operator within Galaxy's Global Markets division. Of this total, $2.5B is included in both Assets Under Management and Assets Under Stake, and $1.7B is included in both assets under stake and the commodity pool operator. Each asset included in these figures generates its own distinct fee stream. (5) Refer to page 5 of this release for a breakout of Galaxy's Treasury & Corporate net digital asset and investment exposure, excluding derivatives. |
|||||
-- Galaxy Financial Snapshot
- Net income of $505 million for Q3 2025, diluted EPS of $1.01, and adjusted EPS of $1.12.1
- Digital Assets generated adjusted gross profit of $318 million and adjusted EBITDA of $250 million, driven by record results in Global Markets and sustained momentum in the Asset Management & Infrastructure Solutions business.1
- Galaxy expects immaterial adjusted gross profit and adjusted EBITDA from the Data Centers segment until the first half of 2026, when it is scheduled to start delivering critical IT capacity and recognizing revenue under Phase I of the lease agreement with CoreWeave.
- Treasury & Corporate generated adjusted gross profit of $408 million and adjusted EBITDA of $376 million, driven by gains across digital asset and investment positions.1
|
|
|
|
|
||||||
|
GAAP Revenues and Transaction Expenses |
Q3 2025 |
Q2 2025 |
Q/Q % Change |
||||||
|
Gross Revenues & Gains/(Losses) from Operations |
$29,219M |
$9,057M |
223 % |
||||||
|
Gross Transaction Expenses |
$28,293M |
$8,630M |
228 % |
||||||
|
|
|
|
|
||||||
|
|
|
|
|
||||||
|
Segment Reporting Breakdown |
Q3 2025 |
Q2 2025 |
Q/Q % Change |
||||||
|
Digital Assets Adjusted Gross Profit1 |
$318M |
$71.4M |
345 % |
||||||
|
Digital Assets Adjusted EBITDA1 |
$250M |
$13.0M |
1,817 % |
||||||
|
|
|
|
|
||||||
|
Data Centers Adjusted Gross Profit1 |
$2.7M |
- |
N.M. |
||||||
|
Data Centers Adjusted EBITDA1 |
$3.7M |
- |
N.M. |
||||||
|
|
|
|
|
||||||
|
Treasury & Corporate Adjusted Gross Profit1 |
$408M |
$228M |
79 % |
||||||
|
Treasury & Corporate Adjusted EBITDA1 |
$376M |
$198M |
90 % |
||||||
|
|
|
|
|
||||||
|
Adjusted Gross Profit1 |
$728M |
$299M |
143 % |
||||||
|
Adjusted EBITDA1 |
$629M |
$211M |
198 % |
||||||
|
|
|
|
|
|
|
|
|||
|
Net Income |
$505M |
$30.7M |
1,546 % |
||||||
|
|
||||||
|
Note: Throughout this document, totals may not sum due to rounding. Percentage change calculations are based on unrounded results. N.M. is the abbreviation for "Not Meaningful". (1) Adjusted EPS, Adjusted Gross Profit and Adjusted EBITDA are non-GAAP financial measures. Please see Non-GAAP Financial Measures below for further information. Refer to pages 10-12 for more information and a non-GAAP to GAAP reconciliation. |
-- Digital Assets
Global Markets
Global Markets delivered record adjusted gross profit of $295 million in the third quarter, driven by heightened activity across spot and derivatives trading and a record Investment Banking quarter.1
- Galaxy's digital asset trading volumes increased 140% in the quarter, reaching all-time highs and outpacing broader market growth amid stronger sentiment and client activity. This included the execution of a $9 billion notional bitcoin sale, or over 80,000 bitcoin, on behalf of a client in the quarter, and robust spot execution for digital asset treasury companies.
- Average loan book size expanded to $1.8 billion in Q3 2025, supported by increased client activity across the lending product suite.
- In Q3 2025, the Investment Banking team acted as co-placement agent and financial advisor on Forward Industries' (Nasdaq: FORD) $1.65 billion private placement and acted as a financial advisor to Coin Metrics on its sale to Talos.
|
|
KEY PERFORMANCE INDICATORS |
|
Q3 2025 |
Q2 2025 |
Q/Q % Change |
|
|||
|
|
Global Markets Adjusted Gross Profit1 |
|
$295M |
$55.4M |
432 % |
|
|||
|
|
Loan Book Size (Average) |
|
$1,768M |
$1,107M |
60 % |
|
|||
|
|
Total Trading Counterparties |
|
1,532 |
1,445 |
6 % |
|
|||
|
|
|
Global Markets Adjusted Gross Profit: Gross Profit from Galaxy trading activity, net of transaction expenses, and fee revenue associated with the |
|
|||||||
Asset Management & Infrastructure Solutions
Asset Management & Infrastructure Solutions generated $23 million of adjusted gross profit in Q3 2025, primarily driven by more than $2 billion of net inflows into the alternatives suite and ETFs during the quarter.1
- Galaxy ended Q3 with nearly $9 billion in assets under management and $7 billion in assets under stake, fueled by strong organic growth and new multi-year mandates from digital asset treasury companies. Collectively, digital asset treasury mandates have added more than $4.5 billion in assets to Galaxy, representing annual recurring fee revenue of over $40 million.2
- Subsequent to quarter end, Galaxy's staking business completed an integration with one of the world's largest digital asset custodians, enabling clients to stake directly to Galaxy validator nodes and establishing a major new distribution channel for the business.
|
|
KEY PERFORMANCE INDICATORS |
|
Q3 2025 |
Q2 2025 |
Q/Q % Change |
|
|||
|
|
Asset Management & Infrastructure Solutions Adjusted Gross Profit1 |
|
|
$23.2M |
$16.0M |
44 % |
|
||
|
|
ETFs |
|
$3,903M |
$3,327M |
17 % |
|
|||
|
|
Alternatives |
|
$4,859M |
$2,405M |
102 % |
|
|||
|
|
Assets Under Stake |
|
$6,610M |
$3,150M |
110 % |
|
|||
|
|
All figures are unaudited. ETFs: Include assets in Galaxy-sponsored and sub-advised exchange-traded funds, including seed investments by affiliates, based on prices as of the end of the specified period. ETF assets include both Galaxy balance sheet and third-party assets. Changes in ETF assets are generally the result of performance, inflows/outflows, and market movements. Alternatives: Includes committed capital closed-end vehicles, fund of fund products, engagements to unwind portfolios, affiliated and unaffiliated separately managed accounts, and seed investments by affiliates, based on prices as of the end of the specified period. For committed capital closed-end vehicles that have completed their investment period, Alternatives are reported as Net Asset Value ("NAV") plus unfunded commitments. Alternatives for quarterly close vehicles are reported as of the most recent quarter available for the applicable period. Assets Under Stake: Represents the total notional value of assets bonded to Galaxy validators, based on prices as of the end of the specified period. These figures include both Galaxy balance sheet and third-party assets. Note: As of Q3 2025, $2.5B of assets are captured within both Assets Under Stake and Alternatives. |
|
|||||||
|
|
|
(1) Adjusted Gross Profit is a non-GAAP financial measure. Refer to page 10 for more information and a reconciliation to the most directly comparable GAAP measure. |
|
(2) Assumes prices for relevant cryptocurrencies as of 9/30/2025. |
-- Data Centers
High-Performance Computing
Helios Data Center Campus: Galaxy remains on schedule to deliver 133 MW of critical IT load to CoreWeave in the first half of 2026 under the Phase I lease agreement.
- Executed a lease agreement with CoreWeave for Phase II of the Helios data center development. CoreWeave also exercised its final option to access an additional 133 MW of critical IT load for its AI and HPC operations, bringing its total commitment to the full 800 MW of approved power capacity at Helios.
- Galaxy secured a $1.4 billion project financing facility, fully funding the $1.7 billion Phase I build at Helios.
- Galaxy expanded the Helios campus through a strategic land acquisition, increasing the total site to over 1,500 acres and 2.7 GW of additional potential power capacity, which remains under study by ERCOT.
|
|
|
|
|
|
|
|
|
Phase I |
Phase II |
Phase III |
Phase I + II + III |
|
|
|
133MW |
260MW |
133MW |
526MW |
|
|
|
Contracted Critical IT Load1 |
Contracted Critical IT Load1 |
Committed Critical IT Load1 |
Total Committed Critical IT Load1 |
|
|
|
|
|
|
|
|
|
|
1H26 |
2027 |
2028 |
$1B+ |
|
|
|
Expected Delivery Date2 |
Expected Delivery Date2 |
Expected Delivery Date2 |
Anticipated Average Annual Revenue3 |
|
|
|
|
|
|||
|
|
(1) Approximately 200 MW of gross power capacity for Phase I, 400 MW of gross power capacity for Phase II, and 200 MW of gross power capacity for Phase III, for a total gross power capacity of 800 MW. (2) Will be completed in phases, with the full capacity for Phase I expected to be delivered by the end of the first half of 2026, Phase II throughout 2027 and Phase III starting in 2028. (3) Based on committed contractual terms, internal estimates for capital expenditures, and assumes full capacity utilization of the 526 MW of critical IT load. Actual results may differ materially due to business, economic and competitive uncertainties and contingencies, which are beyond the control of the Company and its management and subject to change. |
|
|||
-- Balance Sheet
Equity Capital
Below is a breakout of how the Company's $3.2 billion of equity capital is allocated across its Digital Assets, Data Centers and Treasury & Corporate segments.
|
|
$3.2 billion of equity capital across three segments: |
|
||
|
|
~40% |
~25% |
~35% |
|
|
|
Digital Assets |
Data Centers |
Treasury & Corporate |
|
Treasury & Corporate Net Digital Asset and Investment Exposure, Excluding Derivatives
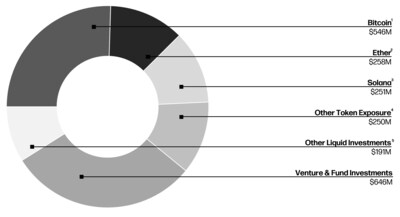
The Company's Treasury & Corporate segment maintains exposure to the digital asset ecosystem through a diversified allocation across spot positions, ETFs, equities, venture investments, private equity holdings and fund investments.
The below pie chart is representative of the Treasury & Corporate segment's net digital asset and investment exposure as of September 30, 2025.
The pie chart does not include derivatives instruments.
|
(1) Includes spot BTC, associated tokens such as wrapped BTC, and interests in investment vehicles designed to hold BTC. |
|
(2) Includes spot ETH, associated tokens such as wrapped ETH, and interests in investment vehicles designed to hold ETH. |
|
(3) Includes spot SOL, associated tokens such as wrapped SOL, and interests in investment vehicles designed to hold SOL, including Galaxy's investment in Forward Industries. |
|
(4) Represents spot and interests in investment vehicles that provide exposure to other digital assets. |
|
(5) Includes publicly traded securities, including those subject to a short-term lock-up. |
Earnings Conference Call
An investor conference call will be held today, October 21, 2025, at 8:30 AM Eastern Time. A live webcast will be available at https://investor.galaxy.com/ and on the Company's YouTube channel. A replay of the webcast will be available and can be accessed in the same manner as the live webcast on the Company's Investor Relations website. Through November 20, 2025, the recording will also be available by dialing 1-844-512-2921, or 1-412-317-6671 (outside the U.S. and Canada) and using the passcode: 10202926.
Galaxy will host an Earnings AMA on Tuesday, October 21 at 11:35 AM Eastern Time via X Spaces which is accessible through Galaxy's X profile (@GalaxyDigitalHQ), during which members of management may discuss the company's financial results and forward-looking statements. See full disclosures below.
About Galaxy Digital Inc. (Nasdaq/TSX: GLXY)
Galaxy Digital Inc. (Nasdaq/TSX: GLXY) is a global leader in digital assets and data center infrastructure, delivering solutions that accelerate progress in finance and artificial intelligence. Our digital assets platform offers institutional access to trading, advisory, asset management, staking, self-custody, and tokenization technology. In addition, we develop and operate cutting-edge data center infrastructure to power AI and high-performance computing workloads. Our 800 MW Helios campus in Texas, which has an additional 2.7 GW of power under study, positions Galaxy among the largest and fastest-growing data center developments in North America. The Company is headquartered in New York City, with offices across North America, Europe, the Middle East, and Asia. Additional information about Galaxy's businesses and products is available on www.galaxy.com
Disclaimer
The TSX has not approved or disapproved of the information contained herein. The Ontario Securities Commission has not passed upon the merits of the disclosure record of Galaxy.
CAUTIONARY STATEMENT ABOUT FORWARD-LOOKING STATEMENTS
This press release and the accompanying conference call may contain "forward-looking statements" within the meaning of Section 27A of the Securities Act of 1933, as amended (the "Securities Act"), Section 21E of the Securities Exchange Act of 1934, as amended (the "Exchange Act") and "forward-looking information" under Canadian securities laws (collectively, "forward-looking statements"). Our forward-looking statements include, but are not limited to, statements regarding our or our management team's expectations, hopes, beliefs, intentions or strategies regarding the future. Statements that are not historical facts, including statements about Galaxy's business plans and goals, including with respect to the lease with CoreWeave, and the parties, perspectives and expectations, are forward-looking statements. In addition, any statements that refer to estimates, projections, forecasts or other characterizations of future events or circumstances, including any underlying assumptions, are forward-looking statements. The words "anticipate," "believe," "continue," "could," "estimate," "expect," "forecast," "intend," "may," "might," "plan," "possible," "potential," "predict," "project," "should," "would" and similar expressions may identify forward-looking statements, but the absence of these words does not mean that a statement is not forward-looking. The forward-looking statements contained in this document are based on our current expectations and beliefs concerning future developments and their potential effects on us taking into account information currently available to us. There can be no assurance that future developments affecting us will be those that we have anticipated. These forward-looking statements involve a number of risks, uncertainties (some of which are beyond our control) or other assumptions that may cause actual results or performance to be materially different from those expressed or implied by these forward-looking statements. These risks include, but are not limited to: (1) the inability to maintain Nasdaq's listing standards; (2) costs related to AI/HPC plans, the transactions, operations and strategy; (3) changes in applicable laws or regulations; (4) the possibility that the Company may be adversely affected by other economic, business, and/or competitive factors; (5) changes or events that impact the cryptocurrency and AI/HPC industry, including potential regulation, that are out of our control; (6) the risk that our business will not grow in line with our expectations or continue on its current trajectory; (7) the possibility that our addressable market is smaller than we have anticipated and/or that we may not gain share of it; (8) the possibility that there is a disruption or change in power dynamics impacting our results or current or future load capacity; (9) any delay or failure to consummate the business mandates or achieve our pipeline goals; (10) technological challenges, cyber incidents or exploits; (11) risks related to retrofitting our existing facility from mining to AI/HPC infrastructure, including the timing of construction and its impact on lease revenue; (12) any inability or difficulty in obtaining additional financing for AI/HPC infrastructure needs on acceptable terms or at all; (13) changes to the AI/HPC infrastructure needs and their impact on future plans at the Helios campus; (14) any delay in, or failure to close, the acquisition of the additional land and power adjacent to the Helios campus currently under contract; (15) risks associated with the leasing business, including those associated with counterparties; (16) risks associated with our GalaxyOne platform; and (17) those other risks contained in filings we make with the Securities and Exchange Commission (the "SEC") from time to time, including in our Quarterly Report on Form 10-Q for the quarter ended June 30, 2025, filed with the SEC on August 5, 2025 and available on Galaxy's profile at www.sec.gov (our "Form 10-Q"). Factors that could cause actual results to differ materially from those described in such forward-looking statements include, but are not limited to, financing and construction terms and conditions, a decline in the digital asset market or general economic conditions; the possibility that our addressable market is smaller than we have anticipated and/or that we may not gain share of the stated addressable market; the failure or delay in the adoption of digital assets and the blockchain ecosystem; a delay or failure in developing infrastructure for our business or our businesses achieving our mandates; delays or other challenges in the mining and AI/HPC infrastructure business related to hosting, power or construction; any challenges faced with respect to exploits, considerations with respect to liquidity and capital planning; and changes in applicable law or regulation and adverse regulatory developments. Should one or more of these risks or uncertainties materialize, they could cause our actual results to differ materially from the forward-looking statements. Except as required by law, we assume no obligation to update or revise any forward-looking statements whether as a result of new information, future events or otherwise, or to update the reasons if actual results differ materially from those anticipated in the forward-looking statements. You should not take any statement regarding past trends or activities as a representation that the trends or activities will continue in the future. Accordingly, you should not put undue reliance on these statements.
This press release and our earnings call contain certain preliminary information about our performance in the third quarter of 2025. This information is preliminary and represents the most current information available to management. The Company's actual consolidated financial statements may differ materially as a result of the completion of normal quarterly accounting procedures and adjustments or due to other risks contained in our Quarterly Report on Form 10-Q for the quarter ended September 30, 2025. Although the Company believes the expectations reflected in this press release are based upon reasonable assumptions, the Company can give no assurance that actual results will not differ materially from these expectations.
Non-GAAP Financial Measures
In addition to our results determined in accordance with GAAP, this press release and the accompanying tables contain adjusted gross profit, adjusted EBITDA, and EBITDA margin, which are non-GAAP financial measures. Adjusted gross profit, adjusted EBITDA, and EBITDA margin are unaudited, presented as supplemental disclosure and should not be considered in isolation or as a substitute for, or superior to, the financial information prepared and presented in accordance with GAAP.
Please see pages 10 and 11 for a reconciliation of adjusted gross profit to revenues and gains / (losses) from operations (including for our individual segments) during the three months ended September 30, 2025 and 2024 and during the three months ended June 30, 2025 and of adjusted EBITDA to net income (loss) (including for our individual segments) during the nine months ended September 30, 2025 and 2024 and during the six months ended June 30, 2025.
It is important to note that the particular items we exclude from, or include in, adjusted gross profit, adjusted EBITDA, and EBITDA margin may differ from the items excluded from, or included in, similar non-GAAP financial measures used by other companies in the same industry. We also periodically review our non-GAAP financial measures and may revise these measures to reflect changes in our business or otherwise.
We believe adjusted gross profit is a helpful non-GAAP financial measure to our management and investors because it eliminates the impact of the directly attributable transaction expenses. As such, it provides useful information about our financial performance, enhances the overall understanding of our past performance and future prospects, allows for greater transparency with respect to important metrics used by our management for financial, risk management and operational decision-making and provides an additional tool for investors to use to understand and compare our operating results across accounting periods.
Adjusted EBITDA is a non-GAAP financial measure that is used by management, in addition to GAAP financial measures, to understand and compare our operating results across accounting periods, for risk management and operational decision-making. This non-GAAP measure provides investors with additional information in evaluating the Company's operating performance. Adjusted EBITDA represents Net income / (loss) excluding (i) equity based compensation, (ii) notes interest expense, (iii) taxes, (iv) depreciation and amortization expense, (v) gains and losses on the embedded derivative on our exchangeable notes which ceased to exist upon consolidation as a result of the Reorganization Transactions, (vi) mining-related impairment loss / loss on disposal of mining equipment, (vii) settlement expense, (viii) other (income) / expense, net and (ix) and reorganization and domestication costs. The above items are excluded from our Adjusted EBITDA because these items are non-cash in nature, or because the amount and timing of these items are unpredictable, are not driven by core results of operations, and render comparisons with prior periods and competitors less meaningful.
EBITDA Margin is defined as EBITDA, divided by revenue minus pass through expenses for the same period. This non-GAAP financial measure is commonly used as an analytical indicator of performance by investors within the industries in which we operate. EBITDA margin is not a measure of financial performance under GAAP. Items excluded from EBITDA Margin are significant components in understanding and assessing financial performance. EBITDA Margin should not be considered in isolation or as an alternative to or a substitute for financial statement data presented in Galaxy's Digital's consolidated financial statements as indicators of financial performance or liquidity (which, in the case of EBITDA margin, is net income margin).
Investors are cautioned that there are material limitations associated with the use of non-GAAP financial measures as an analytical tool.
© Copyright Galaxy Digital 2025. All rights reserved.
Galaxy Digital Inc.'s Consolidated Statements of Financial Position (unaudited)
|
(in thousands) |
September 30, |
|
December 31, |
|
Assets |
|
|
|
|
Current assets |
|
|
|
|
Cash and cash equivalents |
$ 1,137,426 |
|
$ 462,103 |
|
Digital intangible assets (includes $2,673.5 and $1,997.4 million measured at fair value) |
3,785,085 |
|
2,547,581 |
|
Digital financial assets |
322,949 |
|
359,665 |
|
Digital assets loan receivable, net of allowance |
1,299,669 |
|
579,530 |
|
Investments |
853,848 |
|
834,812 |
|
Assets posted as collateral |
714,869 |
|
277,147 |
|
Derivative assets |
152,579 |
|
207,653 |
|
Accounts receivable (includes $4.3 and $4.6 million due from related parties) |
71,953 |
|
55,279 |
|
Digital assets receivable |
4,586 |
|
53,608 |
|
Loans receivable |
635,371 |
|
476,620 |
|
Prepaid expenses and other assets |
78,851 |
|
26,892 |
|
Total current assets |
9,057,186 |
|
5,880,890 |
|
Non-current assets |
|
|
|
|
Digital assets receivable |
16,846 |
|
7,112 |
|
Investments (includes $1,184.0 and $745.5 million measured at fair value) |
1,252,354 |
|
808,694 |
|
Digital intangible assets |
56,500 |
|
20,979 |
|
Loans receivable, non-current |
7,300 |
|
-- |
|
Property and equipment, net |
874,059 |
|
237,038 |
|
Other non-current assets |
195,812 |
|
107,105 |
|
Goodwill |
62,659 |
|
58,037 |
|
Total non-current assets |
2,465,530 |
|
1,238,965 |
|
Total assets |
$ 11,522,716 |
|
$ 7,119,855 |
|
Liabilities and Equity |
|
|
|
|
Current liabilities |
|
|
|
|
Derivative liabilities |
67,400 |
|
165,858 |
|
Accounts payable and accrued liabilities (includes $0.0 and $96.9 million due to related parties) |
421,355 |
|
281,531 |
|
Digital assets borrowed |
3,055,182 |
|
1,497,609 |
|
Payable to customers |
87,249 |
|
19,520 |
|
Loans payable |
316,916 |
|
510,718 |
|
Collateral payable |
2,547,179 |
|
1,399,655 |
|
Other current liabilities |
235,161 |
|
13,034 |
|
Total current liabilities |
6,730,442 |
|
3,887,925 |
|
Non-current liabilities |
|
|
|
|
Notes payable |
1,150,287 |
|
845,186 |
|
Digital assets borrowed - non-current |
9,580 |
|
-- |
|
Other non-current liabilities (includes $43.6 and $0.0 million due to related parties) |
460,088 |
|
192,392 |
|
Total non-current liabilities |
1,619,955 |
|
1,037,578 |
|
Total liabilities |
8,350,397 |
|
4,925,503 |
|
Equity |
|
|
|
|
GDH LP Unit Holders |
-- |
|
2,194,352 |
|
Class A common stock, $0.001 par value; 2,000,000,000 shares authorized and 179,312,261 issued and outstanding |
179 |
|
-- |
|
Convertible Class B common stock,$0.0000000001 par value; 500,000,000 shares authorized and 201,885,332 issued and outstanding |
-- |
|
-- |
|
Additional Paid in Capital |
1,223,981 |
|
-- |
|
Accumulated other comprehensive income (loss) |
(2,605) |
|
-- |
|
Retained Earnings |
540,811 |
|
-- |
|
Total stockholders' equity(1) |
1,762,366 |
|
2,194,352 |
|
Noncontrolling interest |
1,409,953 |
|
-- |
|
Total equity |
3,172,319 |
|
2,194,352 |
|
Total liabilities and equity |
$ 11,522,716 |
|
$ 7,119,855 |
|
|
|
(1) For periods prior to the Reorganization Transactions, represents total GDH LP Unit Holders' Capital. |
Galaxy Digital Inc.'s Consolidated Statements of Operations (unaudited)
|
|
Three Months Ended |
|
Nine Months Ended |
||||
|
(in thousands) |
September 30, |
|
September 30, |
|
September 30, |
|
September 30, |
|
|
|
|
|
|
|
|
|
|
Revenues |
28,401,871 |
|
8,570,657 |
|
50,039,632 |
|
26,788,920 |
|
Gains / (losses) from operations |
816,982 |
|
141,633 |
|
1,091,745 |
|
616,504 |
|
Revenues and gains / (losses) from operations |
29,218,853 |
|
8,712,290 |
|
51,131,377 |
|
27,405,424 |
|
Operating expenses: |
|
|
|
|
|
|
|
|
Transaction expenses |
28,292,777 |
|
8,536,135 |
|
49,869,727 |
|
26,659,061 |
|
Impairment of digital assets |
197,702 |
|
108,466 |
|
437,608 |
|
190,939 |
|
Compensation and benefits |
85,048 |
|
57,290 |
|
206,970 |
|
179,614 |
|
General and administrative |
58,700 |
|
23,931 |
|
164,516 |
|
65,883 |
|
Technology |
11,515 |
|
7,576 |
|
33,000 |
|
21,424 |
|
Professional fees |
14,451 |
|
10,927 |
|
58,014 |
|
38,247 |
|
Notes interest expense |
14,415 |
|
7,105 |
|
42,726 |
|
21,121 |
|
Total operating expenses |
28,674,608 |
|
8,751,430 |
|
50,812,561 |
|
27,176,289 |
|
Other income / (expense): |
|
|
|
|
|
|
|
|
Unrealized gain / (loss) on notes payable - derivative |
-- |
|
(2,858) |
|
(35,544) |
|
(15,144) |
|
Other income / (expense), net |
957 |
|
783 |
|
2,547 |
|
2,608 |
|
Total other income / (expense) |
957 |
|
(2,075) |
|
(32,997) |
|
(12,536) |
|
Net income / (loss) before taxes |
$ 545,202 |
|
$ (41,215) |
|
$ 285,819 |
|
$ 216,599 |
|
Income taxes expense / (benefit) |
40,145 |
|
(7,885) |
|
45,503 |
|
(12,602) |
|
Net income / (loss) |
$ 505,057 |
|
$ (33,330) |
|
$ 240,316 |
|
$ 229,201 |
|
Other comprehensive income (loss), net of tax |
|
|
|
|
|
|
|
|
Change in fair value of cash flow hedges |
(2,605) |
|
-- |
|
(2,605) |
|
-- |
|
Other comprehensive income (loss) |
(2,605) |
|
-- |
|
(2,605) |
|
-- |
|
Comprehensive income (loss) |
$ 502,452 |
|
$ (33,330) |
|
$ 237,711 |
|
$ 229,201 |
|
Comprehensive income / (loss) attributed to: |
|
|
|
|
|
|
|
|
Class B Unit holders of GDH LP |
-- |
|
(21,079) |
|
(204,745) |
|
156,483 |
|
Noncontrolling interests |
296,589 |
|
-- |
|
332,034 |
|
-- |
|
Class A common stockholders of the Company(1) |
$ 205,863 |
|
$ (12,251) |
|
$ 110,422 |
|
$ 72,718 |
|
|
|
|
|
|
|
|
|
|
Net income / (loss) per Class A common stock(2) |
|
|
|
|
|
|
|
|
Basic |
$ 1.19 |
|
$ (0.10) |
|
$ 0.76 |
|
$ 0.61 |
|
Diluted |
$ 1.01 |
|
$ (0.10) |
|
$ 0.56 |
|
$ 0.55 |
|
Weighted average shares outstanding used to compute net income / (loss) per share(3) |
|
|
|
|
|
|
|
|
Basic |
174,709,471 |
|
125,360,919 |
|
148,730,331 |
|
118,988,998 |
|
Diluted |
221,463,809 |
|
341,208,036 |
|
375,881,574 |
|
132,996,975 |
|
|
|||||||
|
(1) For periods prior to the Reorganization Transactions, represents net income / (loss) attributable to Class A Units of GDH LP |
|||||||
Ownership of GDH LP Limited Partnership Interests
|
|
|
September 30, 2025 |
|
December 31, 2024 |
||||
|
|
|
Ownership |
|
% interest |
|
Ownership |
|
% interest |
|
Galaxy Digital Inc. (1) |
|
179,312,261 |
|
47.0 % |
|
-- |
|
-- % |
|
Noncontrolling interests (1) |
|
201,885,332 |
|
53.0 % |
|
-- |
|
-- % |
|
Galaxy Digital Holdings Ltd (1) |
|
-- |
|
-- % |
|
127,577,780 |
|
37.1 % |
|
Class B Unit Holders (1) |
|
-- |
|
-- % |
|
215,862,343 |
|
62.9 % |
|
Total |
|
381,197,593 |
|
100.0 % |
|
343,440,123 |
|
100.0 % |
|
|
|
(1) As a result of the Reorganization Transactions, on May 13, 2025, Galaxy Digital Holdings Ltd. was acquired by Galaxy Digital Inc. and the Class B Unit Holders of GDH LP became noncontrolling interests of Galaxy Digital Inc. The change in relative ownership interests between December 31, 2024 and June 30, 2025 is primarily due to sale of shares by Galaxy Digital Inc. and conversion of Class B units during the period. |
Reconciliation of Revenue and Gains/(Losses) from Operations
The following table reconciles Revenues and gains / (losses) from operations to adjusted gross profit for the three months ended September 30, 2025 and March 31, 2025:
|
|
|
Three Months Ended September 30, 2025 |
||||||
|
(in thousands) |
|
Digital Assets |
|
Data Centers |
|
Treasury and |
|
Total |
|
Revenues and gains / (losses) from operations |
|
$ 28,805,865 |
|
$ 2,662 |
|
$ 410,326 |
|
$ 29,218,853 |
|
Less: Transaction expenses |
|
28,290,508 |
|
-- |
|
2,269 |
|
28,292,777 |
|
Less: Impairment of digital assets |
|
197,702 |
|
-- |
|
-- |
|
197,702 |
|
Adjusted gross profit |
|
$ 317,655 |
|
$ 2,662 |
|
$ 408,057 |
|
$ 728,374 |
|
|
|
Three months ended June 30, 2025 |
||||||
|
(in thousands) |
|
Digital Assets |
|
Data Centers |
|
Treasury and |
|
Total |
|
Revenues and gains / (losses) from operations |
|
$ 8,711,215 |
|
$ -- |
|
$ 345,434 |
|
$ 9,056,649 |
|
Less: Transaction expenses |
|
8,596,478 |
|
-- |
|
33,462 |
|
8,629,940 |
|
Less: Impairment of digital assets |
|
43,307 |
|
-- |
|
84,170 |
|
127,477 |
|
Adjusted gross profit |
|
$ 71,430 |
|
$ -- |
|
$ 227,802 |
|
$ 299,232 |
Reconciliation of Adjusted EBITDA
The following table reconciles the Company's adjusted EBITDA figures to net income for the three months ended September 30, 2025 and June 30, 2025:
|
(in thousands) |
|
Digital Assets |
|
Data Centers |
|
Treasury and |
|
Three Months |
|
Net income / (loss) |
|
$ 234,392 |
|
$ 2,104 |
|
$ 268,561 |
|
$ 505,057 |
|
Add back: |
|
|
|
|
|
|
|
|
|
Equity based compensation |
|
11,989 |
|
1,645 |
|
8,423 |
|
22,057 |
|
Notes interest expense and other expense |
|
-- |
|
-- |
|
14,415 |
|
14,415 |
|
Taxes |
|
-- |
|
-- |
|
40,145 |
|
40,145 |
|
Depreciation and amortization expense |
|
3,812 |
|
-- |
|
3,585 |
|
7,397 |
|
Unrealized (gain) / loss on notes payable – derivative |
|
-- |
|
-- |
|
-- |
|
-- |
|
Mining related impairment loss / loss on disposal |
|
-- |
|
-- |
|
38,027 |
|
38,027 |
|
Settlement expense |
|
-- |
|
-- |
|
1,810 |
|
1,810 |
|
Other (income) / expense, net |
|
(272) |
|
(90) |
|
(595) |
|
(957) |
|
Reorganization and domestication costs |
|
-- |
|
-- |
|
1,401 |
|
1,401 |
|
Adjusted EBITDA |
|
$ 249,921 |
|
$ 3,659 |
|
$ 375,772 |
|
$ 629,352 |
|
(in thousands) |
|
Digital Assets |
|
Data Centers |
|
Treasury and |
|
Three Months |
|
Net income / (loss) |
|
$ (2,535) |
|
$ -- |
|
$ 33,226 |
|
$ 30,691 |
|
Add back: |
|
|
|
|
|
|
|
|
|
Equity based compensation |
|
11,826 |
|
-- |
|
6,957 |
|
18,783 |
|
Notes interest expense and other expense |
|
-- |
|
-- |
|
12,042 |
|
12,042 |
|
Taxes |
|
-- |
|
-- |
|
11,470 |
|
11,470 |
|
Depreciation and amortization expense |
|
3,560 |
|
-- |
|
3,898 |
|
7,458 |
|
Mining related impairment loss / loss on disposal |
|
-- |
|
-- |
|
15 |
|
15 |
|
Unrealized (gain) / loss on notes payable – derivative |
|
|
|
|
|
125,150 |
|
125,150 |
|
Settlement expense |
|
-- |
|
-- |
|
1,557 |
|
1,557 |
|
Other (income) / expense, net |
|
112 |
|
-- |
|
(918) |
|
(806) |
|
Reorganization and domestication costs |
|
-- |
|
-- |
|
4,867 |
|
4,867 |
|
Adjusted EBITDA |
|
$ 12,963 |
|
$ -- |
|
$ 198,264 |
|
$ 211,227 |
Reconciliation of Adjusted Income (Loss) per Share
The adjusted income (loss) per share represents the diluted income (loss) per Class A common stock assuming all outstanding noncontrolling interest holders exchanged their LP units in GDH LP for Class A common stock of the Company. In periods where the noncontrolling interest is already included in the GAAP diluted income (loss) per share, the adjusted income (loss) per share is identical to the GAAP income (loss) per share.
The following table reconciles the Company's adjusted income (loss) per share figures to diluted income (loss) per share for the three and nine months ended September 30, 2025:
|
|
|
Three Months Ended |
|
Nine Months Ended |
||||
|
(in thousands, except for share data and per share amounts) |
|
September 30, |
|
September 30, |
|
September 30, |
|
September 30, |
|
Net income used to calculate diluted EPS |
|
$ 223,156 |
|
$ (33,330) |
|
$ 209,257 |
|
$ 72,718 |
|
Noncontrolling interest income, net of tax |
|
253,139 |
|
-- |
|
-- |
|
156,483 |
|
Net income used to calculate adjusted income (loss) per share |
|
$ 476,295 |
|
$ (33,330) |
|
$ 209,257 |
|
$ 229,201 |
|
|
|
|
|
|
|
|
|
|
|
Weighted average number of Class A Common Stock shares for the |
|
221,463,809 |
|
341,208,036 |
|
375,881,574 |
|
132,996,975 |
|
Noncontrolling interest weighted average shares outstanding |
|
202,646,202 |
|
-- |
|
-- |
|
215,894,031 |
|
Weighted average number of Class A Common Stock shares for the |
|
424,110,011 |
|
341,208,036 |
|
375,881,574 |
|
348,891,006 |
|
|
|
|
|
|
|
|
|
|
|
Adjusted income (loss) per share |
|
$ 1.12 |
|
$ (0.10) |
|
$ 0.56 |
|
$ 0.66 |
All figures are in U.S. Dollars unless otherwise noted.
SOURCE Galaxy Digital Inc.

Michael Wursthorn, [email protected]
Share this article